RENASANT (RNST)·Q4 2025 Earnings Summary
Renasant Posts Strong Q4 as First Bancshares Integration Gains Traction
January 27, 2026 · by Fintool AI Agent
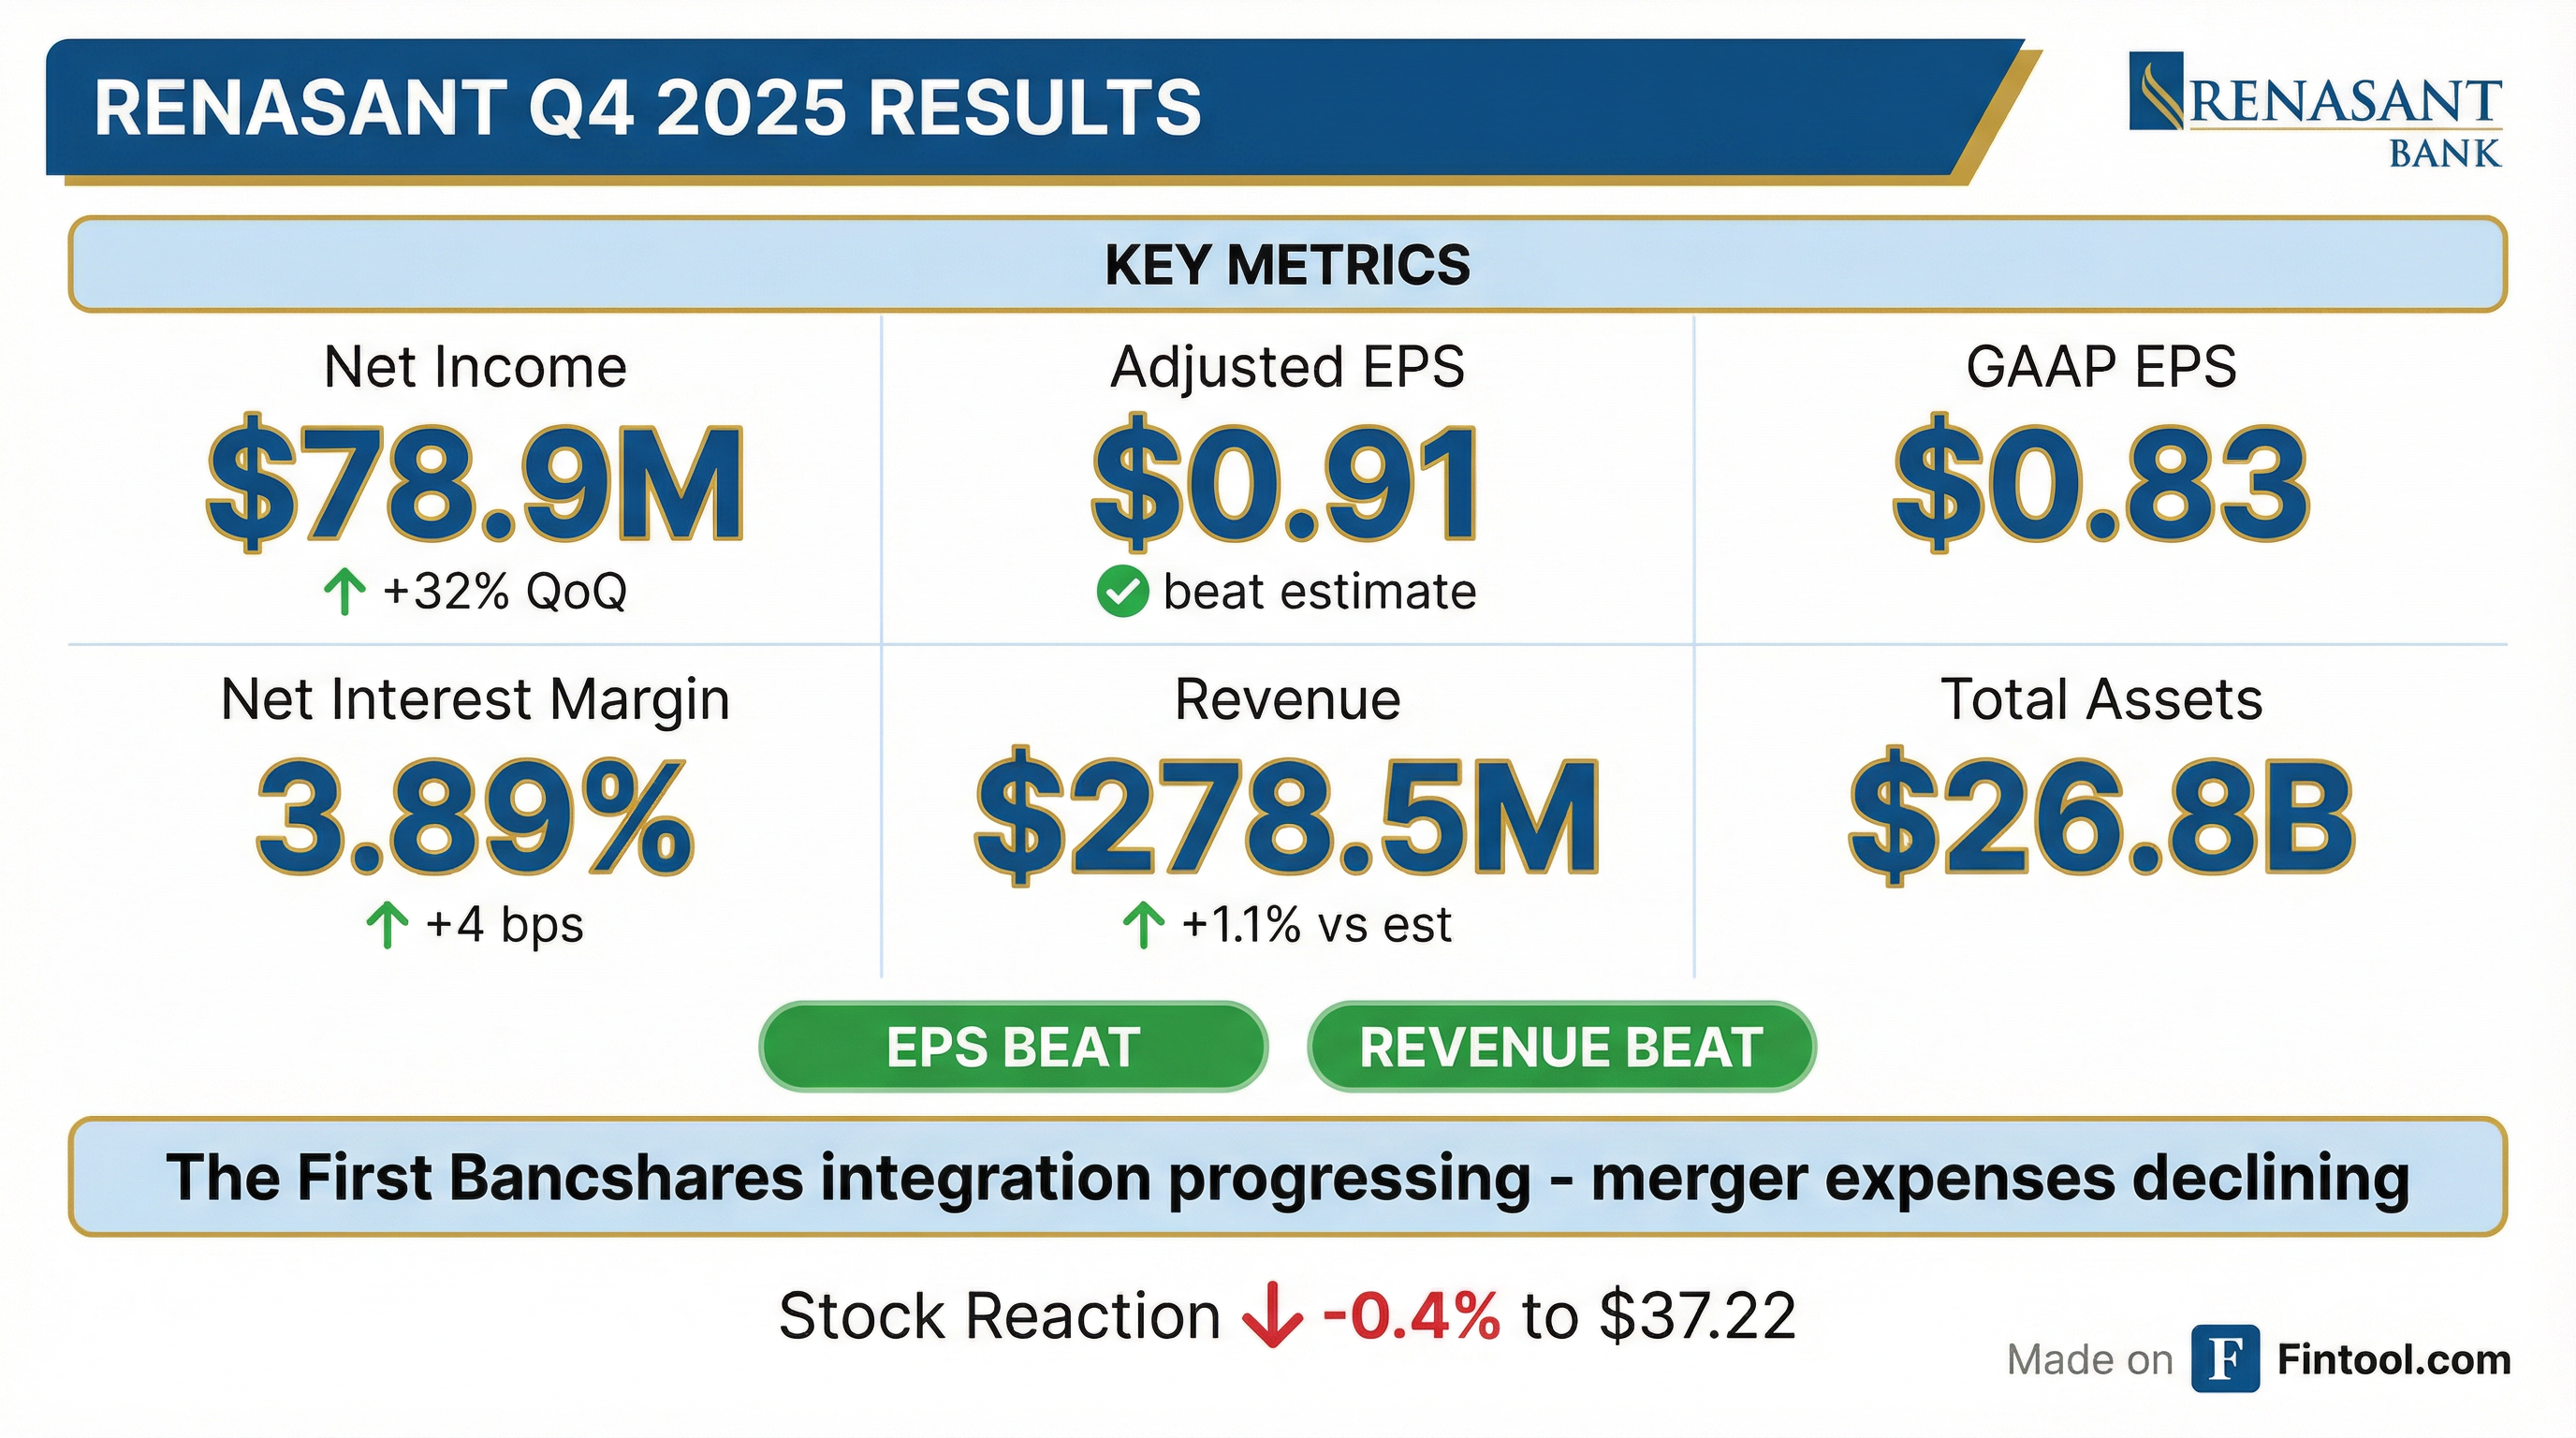
Renasant Corporation (NYSE: RNST) delivered a strong Q4 2025, posting adjusted EPS of $0.91 that beat analyst expectations by 16% as merger integration with The First Bancshares drove improving profitability. Net income jumped 32% sequentially to $78.9 million, with net interest margin expanding 4 basis points to 3.89%.
The stock traded down 0.4% to $37.22 following the announcement, suggesting the beat was largely anticipated after Q3's strong results signaled integration momentum.
Did Renasant Beat Earnings?
Yes — Renasant beat on both EPS and revenue.
*Values retrieved from S&P Global
The strong EPS beat was driven by declining merger expenses and improving net interest income. GAAP EPS of $0.83 includes $10.6 million of merger and conversion expenses ($0.08 per share drag).
What Drove the Beat?
Net Interest Margin Expansion
Net interest income (FTE) rose to $232.4 million, up $4.2 million linked quarter. Net interest margin expanded 4 basis points to 3.89%, driven by a 17 basis point decline in cost of deposits to 1.97%.
The 53 basis point year-over-year NIM expansion reflects both rate benefits and The First merger's accretion. Excluding purchase accounting adjustments, adjusted NIM was flat at 3.62% linked quarter.
Merger Synergies Materializing
Noninterest expense declined $13.1 million linked quarter, including a $6.9 million reduction in merger and conversion expenses. The company recognized $2.1 million in net gains from branch consolidations related to The First integration.
The core systems conversion of The First was completed in August 2025, and the company redeemed $60 million in subordinated notes acquired from The First on October 1, 2025.
What Did Management Say?
"2025 was a transformative year for Renasant, marked by considerable improvement in our profitability and strong balance sheet growth on the heels of the completion of the largest merger in the company's history."
— Kevin D. Chapman, President and CEO
On peer performance and aspirations:
"Our goal is to be a top-performing company in all areas, including our financial metrics. 18 months ago, that would have put us in the top quartile of our peer group. Well, today, we're not in that top quartile. The peer has moved. What's exciting about what's happened with our peer groups is it's forced us to continue to set our sights on higher goals."
— Kevin D. Chapman, President and CEO
On workforce optimization:
"If you go back and look at our FTEs — us and The First — back in Q2 2024, that was a little over 3,400 employees. As we stand right now, that number is sub-3,000. So we've eliminated 400 positions. That all hasn't been The First, by the way, and it all hasn't been by way of the merger."
— Kevin D. Chapman, President and CEO
What Did Management Guide?
Management provided forward-looking guidance on the Q4 earnings call:
Loan Repricing Opportunity: Approximately $1.3 billion in fixed-rate loans at ~5.25% will reprice, with new and renewed loans coming on at upper 5s to low 6s.
Capital Priorities: Buybacks are the most attractive capital lever near-term, with M&A still on the table for the right opportunity.
Q&A Highlights
On Loan Growth and Payoffs (Michael Rose, Raymond James):
- Production was strong in Q4, but payoffs were elevated after being lower than expected for 10+ months
- Backing out the $117M loan sale, underlying growth was ~3% annualized
- Consumer lending has pulled back "more by choice than consumer behavior"
On Expense Trajectory (Stephen Scouten, Piper Sandler):
- Eliminated 12 producers in Q4 (accountability measures), added 6
- May invest in back-office scalability for larger asset size
- "Our goal is to be high performing. Not high performing excluding all the bad stuff, but high performing."
On Deposit Competition (Jordan Ghent, Stephens):
- Competition "probably a little more competitive incrementally on the deposit side"
- 5-month CD special rate stuck at 4% for ~18 months; hope for relief in 2026
- Main margin vulnerability is on the funding side
On the Loan Sale (Jordan Ghent, Stephens):
- Portfolio was secured by cash surrender value of life insurance policies
- Acquired by The First through a previous deal; flagged as non-core during diligence
- No other portfolios flagged for divestiture
On Buybacks (Catherine Mealor, KBW):
- Q4 repurchase activity was light relative to authorization
- Expect ~50-60 bps of CET1 accretion from earnings; willing to use that capacity for buybacks
Balance Sheet Highlights
The combined company now has $26.8 billion in assets, with meaningful geographic diversification across the Southeast.
Loan Growth Modest After Portfolio Sale
Loans increased $21.5 million linked quarter (0.4% annualized), though underlying growth was stronger. During Q4, Renasant sold $117.3 million of loans acquired from The First that were not considered core to Renasant's business.
Loan Composition (Q4 2025):
- CRE Non-Owner Occupied: 33% ($6.25B)
- Real Estate 1-4 Family: 24% ($4.64B)
- CRE Owner Occupied: 17% ($3.33B)
- Commercial & Industrial: 15% ($2.82B)
- Construction & Land Dev: 10% ($1.91B)
- Consumer: 1% ($0.11B)
CRE Non-Owner Occupied Breakdown:
Conservative LTV ratios across property types: 97% of multi-family loans, 86% of retail, and 98% of warehouse/industrial have LTVs below 75%.
Deposit Mix Shift
Deposits increased $48.5 million linked quarter, but noninterest-bearing deposits declined $194.5 million. NIB deposits now represent 23.5% of total deposits.
How Is Credit Quality Holding Up?
Credit quality remains manageable but bears watching:
Important context on payment status: 48% of nonperforming loans were less than 30 days past due at quarter-end, and 80% of criticized loans were current on payments. This suggests many of these credits are performing despite their classified status. The average NPL balance is $305K and average criticized loan balance is $550K.
Net charge-offs rose to $9.1 million in Q4, including $2.5 million from the sale of the non-core loan portfolio acquired from The First. Criticized loans declined 28 basis points to 2.94% of total loans, a positive trend.
Capital and Shareholder Returns
Capital ratios remain strong post-merger:
Tangible book value increased 3.7% linked quarter to $24.65. The company repurchased $13.2 million of stock at $34.29 average price under its $150 million authorization (expires October 2026).
Securities Portfolio
The securities portfolio totals $3.7 billion (amortized cost), representing 13.4% of assets, with duration of 3.8 years. Composition is weighted toward agency mortgage-backed securities (Agency MBS 31%, Agency CMO 28%, Agency CMBS 15%) with Municipals at 15%. Unrealized losses in AOCI totaled $128.9 million ($97.0M net of tax).
How Did the Stock React?
RNST shares traded down 0.4% to $37.22 following the earnings release. The muted reaction suggests the beat was partially anticipated after Q3's strong results demonstrated integration progress.
At $37.22, RNST trades at:
- 1.5x tangible book value ($24.65 TBV)
- 0.9x book value ($41.05 BV)
- Stock is up 7% from its 52-week low of $26.97 and down 8% from its 52-week high of $40.40
What to Watch Going Forward
- Expense Trajectory: Management guided to $2-3M core expense reduction in Q1 with no remaining merger charges
- Deposit Costs: Funding side is the "main vulnerability" in margin outlook per CFO Jim Mabry
- Loan Growth: Pipeline strong across segments; payoffs the "wild card" for quarterly growth
- Fixed-Rate Repricing: $1.3B at 5.25% repricing into upper 5s/low 6s represents upside to NII
- Capital Deployment: Watch for accelerated buyback activity with CET1 at 11.25%